I got bored on a rainy Sunday and I thought I would try to mix mathematic and JavaScript.
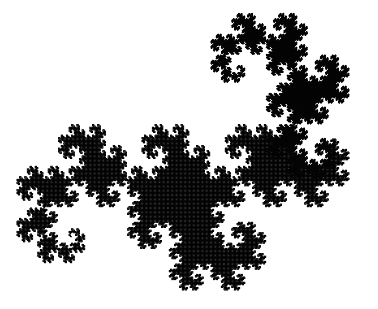
I love fractals and I saw neat golfed examples of what you can do with the canvas (e.g. this 128 bytes dragon’s curve), so I tried to create a simple dragon’s curve generation visualisation.
My attempt displays splittings of the initial segment as it gradually turns into a curve.
Here is the full code. To make it work, you need a fixed-size canvas whose id is a (demo at the end).
// Canvas properties
c = a.getContext("2d");
W = a.width;
H = a.height;

// Starting points
p = [
  [W / 3, H / 3],
  [(2 * W) / 3, (2 * H) / 3],
];
j = l = i = 1;

// Map each key to a number
for (x in c) {
  c[j++] = c[x];
}

n = setInterval((_) => {
  // Draw lines
  c[33](0, 0, W, H);
  c[36]();
  for (j = l; j--; c[55](p[j][0], p[j][1], 1, 1));
  c[38]();

  // Create new separation
  p.splice(
    i,
    0,
    ((p, b, d) => [
      0.5 * (p[0] + b[0] + d * (p[1] - b[1])),
      0.5 * (p[1] + b[1] + d * (b[0] - p[0])),
    ])(p[i - 1], p[i], (i % 4) - 2),
  );

  // Update index and length
  i = (i += 2) > ++l ? 1 : i;

  // Breakpoint
  l > 4000 && clearInterval(n);
});
Let’s break it down:
The first part create variables used during the generation:
cthe canvas’s contextWthe canvas’s widthHthe canvas’s height
All points are vectors, the x is represented with the first element and y with the second.
The starting point of the generation is a simple line, going from the first third to the last third of the canvas.
jis a general increment valuelthe length of the curveithe current index in the curve
I use four functions of the canvas’s context: c.clearRect, c.beginPath, c.stroke and c.lineTo.
But with the following piece of code I can call c[31], c[34] and so on:
for (x in c) {
  c[j++] = c[x];
}
Next we define our interval which will act as the rendering loop. We store it in a variable to be able to stop it later, but this can be omitted.
The first part of the loop draw the current state, all lines between the points.
This erase everything in the canvas, giving us a fresh start.
c.clearRect(0, 0, W, H);We are drawing a path, i.e. a continuous line on the canvas. Those two instructions start and finish the line.
c.beginPath();
// ...
c.stroke();
Now the fun part, let’s start by decomposing the loop:
for (j = l; j-- > 0; ) {
  c.lineTo(p[j][0], p[j][1], 1, 1);
}
We are iterating through the whole point array, from last to first, creating a new line each time.
The j-- > 0 is simplified to j-- since 0 is falsy.
The c.line part is inserted in the for statement.
We are only generating a new point at a time, in order to produce the growth animation.
To insert a new element in the array at position i, we use the splice method:
p.splice(i, 0, new_element);We call a function that use the current and previous element to generate the new points. d is the direction of the rotation, which alternate between 1 and -1, depending on the current index.
((p, b, d) => [x, y])(p[i - 1], p[i], (i % 4) - 2);The new element use the matrix transformation operation (defined here), but simplified to perform both rotation at the same time:
0.5 * (p[0] + b[0] + d * (p[1] - b[1]));
0.5 * (p[1] + b[1] + d * (b[0] - p[0]));
The actual formulas are:
xc = 1/2 * ( xa + ya + xb - yb )
yc = 1/2 * ( - xa + ya + xb + yb )

and

xc = 1/2 * ( xa - ya + xb + yb )
yc = 1/2 * ( xa + ya - xb + yb )
Using the d variable we can factor them.
Now we update our variables:
i = (i += 2) > ++l ? 1 : i;lis incremented, since we just added a new point in the arrayigrow two by two and when it gets bigger thanl, it goes back to one
We increment the current index by two because, as we want to proceed the next element in the array, we just added a new one. And we never proceed the first element since the matrix operations are done on the nth and nth-1 elements.
You can try it below:
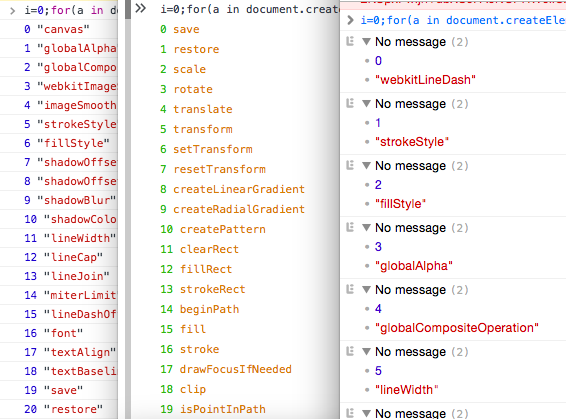
Compatibility note: The name to number hack for the canvas context make this works only on Chrome. The other browsers does not have the same ordering. For this demo, this hack is not used.
i.e. with Chrome, Firefox and Safari:

Using the snippet:
i = 0;
for (a in document.createElement("canvas").getContext("2d")) {
  console.log(i++, a);
}
You can change de corresponding code with the following:
| c.clearRect | c.beginPath | c.stroke | c.lineTo | |
|---|---|---|---|---|
| Firefox | 11 | 14 | 16 | 32 |
| Safari | 34 | 36 | 47 | 39 |